Getting Started with Vyopta
We’re proud to announce our new online demo environment is now live, and it’s free! Learn how good you could have it as an IT professional by tinkering, testing, and exploring Vyopta’s vAnalytics Real-Time Monitoring, Custom Alerts, and Historical Analytics functionality (without having to make contact with humans…unless you want to). You’ll find out just how real your struggle to efficiently manage thousands of calls across a large, multi-vendor video environments is and have all the ammo you need to prove it to your boss.
How to get started:
- Start your demo at www.vyopta.com/demo.
- Watch our 10-minute video (below) to get the most out of your demo experience.
- Skim our comprehensive guide (below) for helpful tips and tricks.
Yep, that’s it! If you have questions, please contact us. We’re ready and waiting to help!
OVERVIEW: Real-Time Monitoring Module
Support teams struggle to efficiently wrangle real-time video performance data whether they are aware of it or not. These days is a rarity to find a large company with only one video conferencing solution. This leads to challenges like; fragmented and incomplete network data, expert-level technology expertise to troubleshooting a call, hour of wasted time manually manipulating spreadsheets, etc. vAnalytics’ Real-Time Monitoring will arm you with all the data points you need to troubleshoot effectively. You’ll gain deep insights into live call status, capacity, and call quality performance in a single, unified dashboard. No more running around and making multiple phone calls to solve a single issue, you will be able to quickly detect, diagnose and resolve video conferencing issues.
Once you begin your vAnalytics demo, we recommend first checking out our Real-Time Monitoring module. Below is the first page you’ll see once you’ve selected the module. We’ve worked closely with IT professionals from companies like; Adobe, Bloomberg, Cimpress (formerly Vistaprint), Harvard, Groupon, US Department of Veteran Affair, and more to make sure it’s easy to quickly note where issues are occurring. Simply note whatever is red and click on it. It’s that simple.

Live Capacity and Licensing Data
The first issues we recommend addressing with Real-Time Monitoring are capacity bottlenecks by drilling into video bridge, call, and device capacity. Capacity issues can sneak up on you because it is difficult to compare the number of calls you have to actual license usage. By selecting the Capacity tab, vAnalytics breaks capacity consumption down into simple percentages so you can find bottlenecks no matter how you buy or consume the technology. You can see both capacity and status of your infrastructure in the Capacity tab, and click on any device to go to the configuration page for that device.

Comprehensive Video Endpoint Status
Immediately see all bridge, call control, and endpoints in your entire system and if they are in working order or need attention. For example, click on the “down” endpoints to see a list of the unavailable devices, and easily click on any of them to go straight to the configuration for that device itself. It is important to note that vAnalytics is the only tool that has the ability to monitor if hardware endpoints are alive and able to make a call in real-time. Meanwhile, most vendor systems will only ping the endpoint in order to receive a response.

Active Video Calls and Meeting Performance
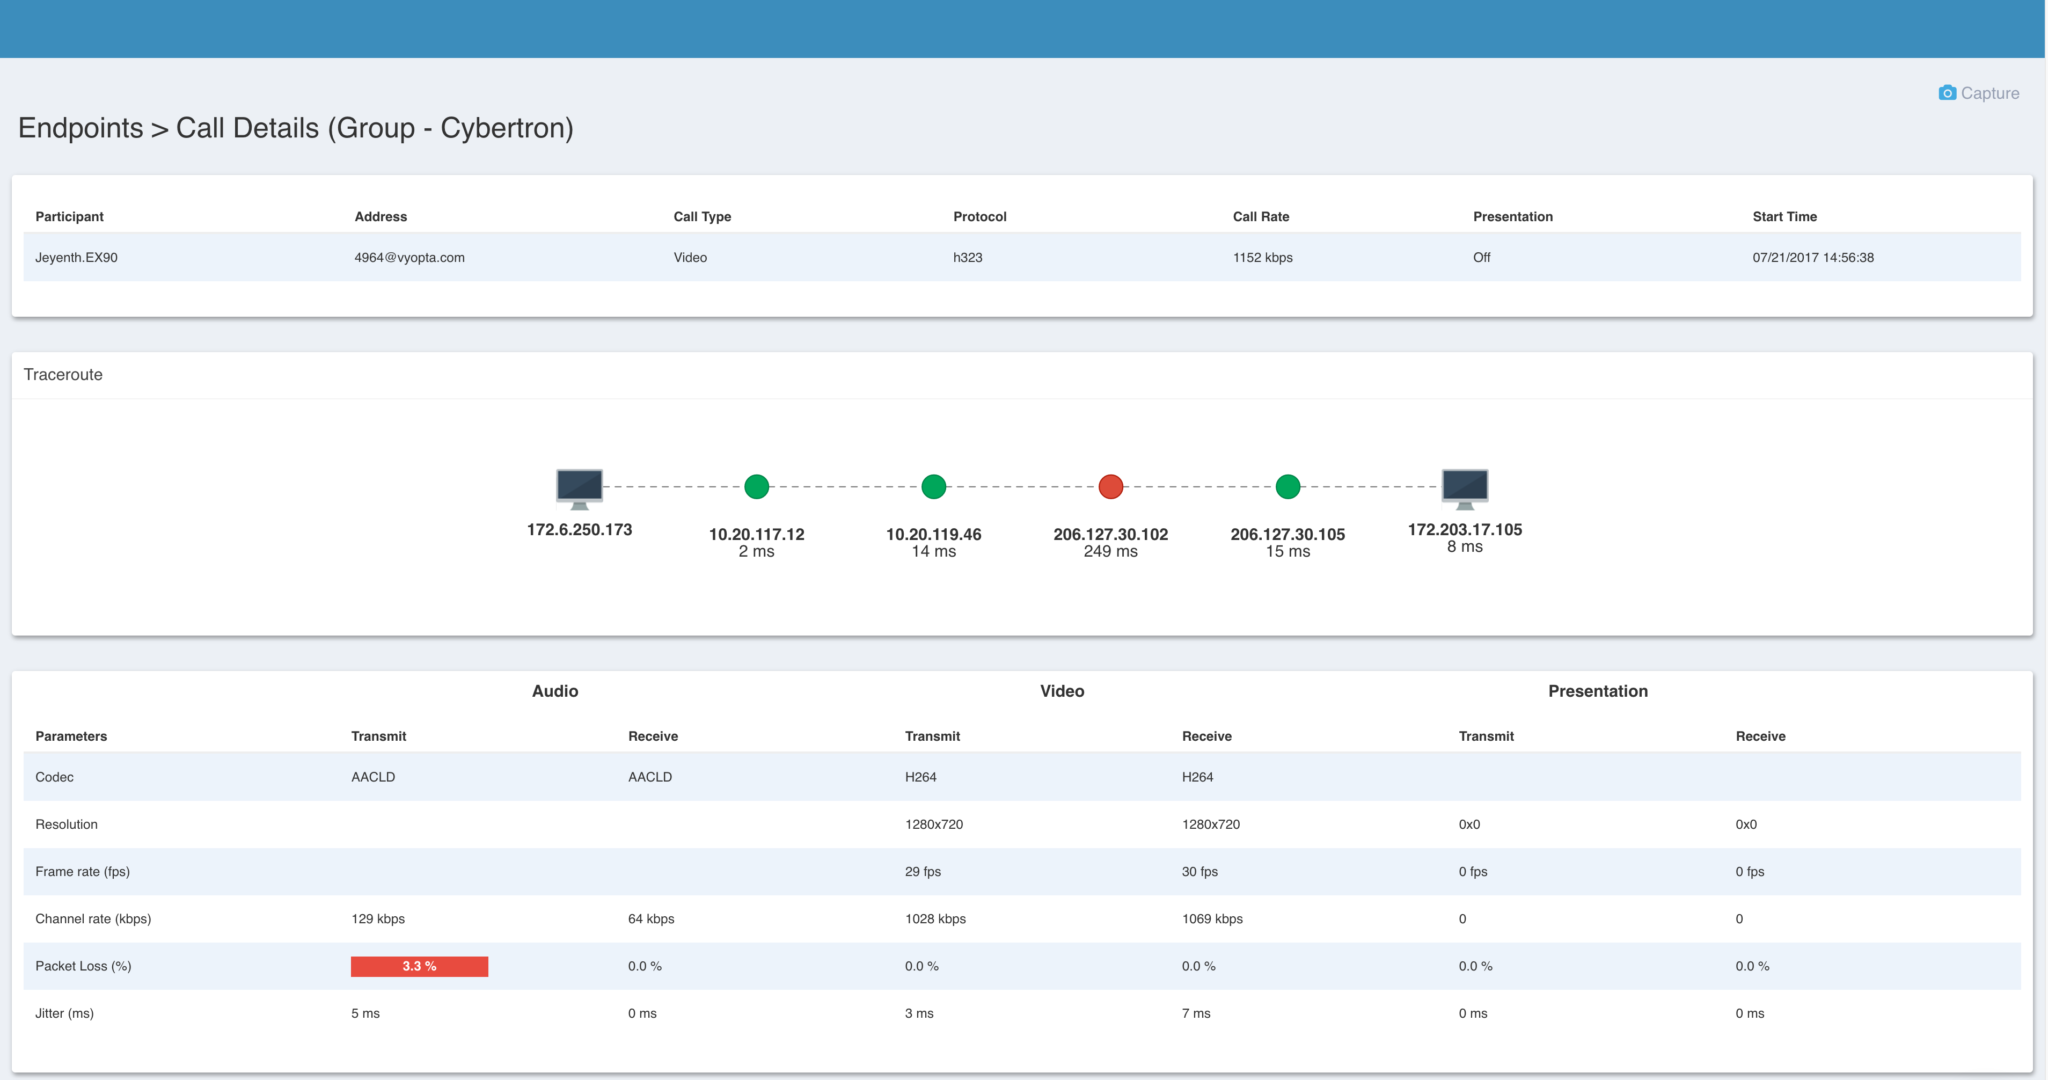
We’ve made it simple to access to individual participant and call leg details. In just a few clicks from the vAnalytics dashboard, you can find a call by locating the red indicator on your Call Quality Panel. In one click, you’ll be taken to a list of assorted list of calls with “bad” quality located towards the top so you can conveniently take action. By selecting a specific call, you can be taken to the call details to learn more about why the call may have gone poorly. Here you can see the transmit side of this call from a software endpoint is the problem. It’s likely the participants WiFi is causing this call a negative experience.

OVERVIEW: Customizable Alert System
We know you can’t sit and stare at a screen and watch for issues or wait for user complaints. Besides, who wants to do that? Our Intelligent Alerts module will allow for you to set any of the conditions mentioned above as an automatic alert. By setting an alert for a specific condition, you (and your team) will receive an email immediately or whatever time or date you choose. For example, one of the more popular alerts our customers use is to create a custom list of “down devices.” Often, IT teams will want to monitor their executive team’s endpoints at the office, in their home, or whatever fancy summer home. They want to know if their device is down for more than 2 minutes so they can fix the problem remotely before they even notice.
Additionally, you can also set up a bridge capacity alert for older bridges. Perhaps you want this type of alert email to go directly to your helpdesk software like Zendesk or ServiceNow. Easy enough! Vyopta was sure to provide a simple integration requiring zero complex administrator privileges in your configuration settings so you can route your alerts as you wish. If interested, see this blog for more info.

OVERVIEW: Historical Analytics Module
The Historical Analytics module in vAnalytics makes managing your collaboration technology simple by collecting, organizing, and presenting all the relevant performance, adoption, and capacity data in a single place. At Vyopta, we instantly take care of all that for you! The Historical module organized to support the problems you’re working to solve including; adoption, issues, capacity, meetings, endpoints and reports (left-hand navigation). Meanwhile, the Historical Dashboard is the only way any collaboration administrator can take 5 minutes and check the status and usage of their entire video conferencing environment.
At the top, you can see metrics like total video minutes, meetings, active and total endpoints. These powerful insights are derived through a lot of complex merging, cleaning, and deduplication of data collected from every single video device, from endpoints to bridges, in your network. Meanwhile, as you scroll you’ll see some of the most popular visualizations such as the interactive Meetings Activity Panel with selectable sorting and data elements.
Bonus Features:
- The ability to set custom date ranges and have this follow you around the tool, you’ll find this to the top right.
- All dashboards, panels, and preferences across the tool are customizable for every unique user.

For example, if you’re trying to get more usage out of a single or set of video endpoints you can drill into vAnalytics to view utilization by individual endpoint or set of endpoints. You’ll find granular insights per endpoint in minutes and/or percent of an adjustable work week. You’ll be able to click through for the details or endpoints by utilization to find out exactly which endpoints are being used a lot, a little, or not at all.
Video Adoption Insights
Adoption is the biggest indicator as to whether or not you have a positive or negative return on your video conferencing investment. More, high-quality video meetings leads to higher productivity, less travel, more collaboration, and increased employee happiness. vAnalytics by Vyopta will show you who is or is not using your video technology, how they are connecting, what technology they prefer, and important usage patterns. In the Adoption tab, you’ll find usage trends over time and be provided the ability to drill in and find specific details to help you improve adoption. For instance, you can track the success of a new video conferencing deployment or track the deprecation of older technology.

Video Call Issues and Call Performance
The Issues Tab is designed to highlight problems video call connections, call failure, and network performance (a.k.a. call quality). You’ll be able to see your overall connection rate and trends over time. You can also view the breakdown of why calls are failing and even sort using custom filters to identify SIP Toll Fraud Spam. From there, you can use Source Caller information and block these IP addresses and remove these failed calls from your statistics so they are more accurate.
For call quality performance, you can get the same overall visuals and trends over time. Easily correlate “bad” quality spikes i to reductions in usage and dig into the call details with just a few, quick clicks. You’ll be able to things like if a majority of the problems come from a few devices in a central location. By working with the network team, you can work to alter some configurations and get additional bandwidth to that location.

Capacity for Infrastructure
In the Capacity tab, you can view all licensing and infrastructure call capacity in simple percentages. In the example below, see that Cisco MCUs are calculated according to concurrent video ports (calls), but Acano capacity are calculated fractionally by HD Ports. To make things easier, we’ve gone ahead and made sure they both appear as simple percentages.
Hovering over these details will reveal more details about the specific peak time of that day, week, month or quarter. Clicking on a data point opens up the full list of participants and the peak usage on that specific day taken every 10 minutes. This way you can easily see the frequency and causes of your infrastructure usage. By using vAnalaytivs, you’ll be able to find if these peaks happen frequently, or if they can be attributed to one large meeting that took place. If you can arm yourself with this information, you can make better decisions about the kinds of licenses you purchase and avoid capacity problems.

Flexible Meeting, VMR, and Participant Data
The Meetings tab contains your underlying data. The subtabs at the top allow you to pivot around a couple unique concepts: meetings, participants, and VMRs. The initial tab is a Vyopta original. We use intelligent algorithms to group calls into meetings so you can click in to any meeting to display participant information. From there, you can apply search and filter criteria to pinpoint meetings with low quality, low attendance, etc.
Something new users often overlook (because they are overwhelmed by our awesomeness) is the Total vs Unique Participants chart. This can be used to identify meetings where participants had to drop and rejoin several times. This is likely a situation you will want to drill into, especially if you are able to identify a trend. It might also provide a “wow” experience to follow up with these call participants to see what happened, and assure them the issues will be addressed.
The VMR (Virtual Meeting Room) tab organizes the data around the individual conference room names. When you have deployed static VMRs, it is important to know who is using them and how much as a way to track adoption.
The Participants tab organizes around specific participants so you can look up a person or endpoint and see which meetings they joined and how they performed with full quality details for every channel. This provides the underlying call quality data used throughout the rest of the Historical Analytics module.
Video Endpoint Details and Vulnerability Information
The Endpoints tab provides another dynamic table. Any search or filter criteria that can be applied by clicking through a visual in one of the dashboards or applied manually on this page instantly changes the numbers reflected at the top. There are also subtabs on this page, but they are a little different. Instead of pivoting the data, they store a lot of the details that are helpful, but not present throughout the rest of the product. This includes details for calls that happened on unmanaged devices that are not part of your network as well as inventory data.
The Inventory subtab is useful for monitoring your devices, especially with our new vulnerability feature. You’ll be able to pull information online about recent exploits and uses information about endpoint firmware and model numbers to create a list of all susceptible devices in your network.

Exports and Automated Reports
You can stop and export any information from anywhere in vAnalytics. For instance, you can send your entire Issues tab to your network team immediately, or schedule to send at a specific cadence. When generating a report, it will take about five minutes to receive an email that contains;
- A full product screenshot
- Underlying data in excel or CSV
- A link back to the specific data in vAnalytics
You and your team will always have all the details you need to execute!
Thanks for reading! If you’re interested in having the right data at your fingertips so you don’t have to work so hard, start an online demo or contact us for more details.


