November has been a great month for weather in Austin. In classic Texas fashion, we have varied between 40℉ and 90℉ while enjoying tons of sunshine. All of this is great, but it doesn’t matter to our product team since they have secluded themselves indoors working on improving vAnalytics. Here are some of the latest updates that have been added this month.
Drill Across – Infinite Drill
Something you may not have noticed is that we have linked our underlying data for performance, participants, and meetings so that you can now click through various individual call and endpoint records to better understand the relationship between usage and performance.

How to drill across technologies
How To: Custom Reporting
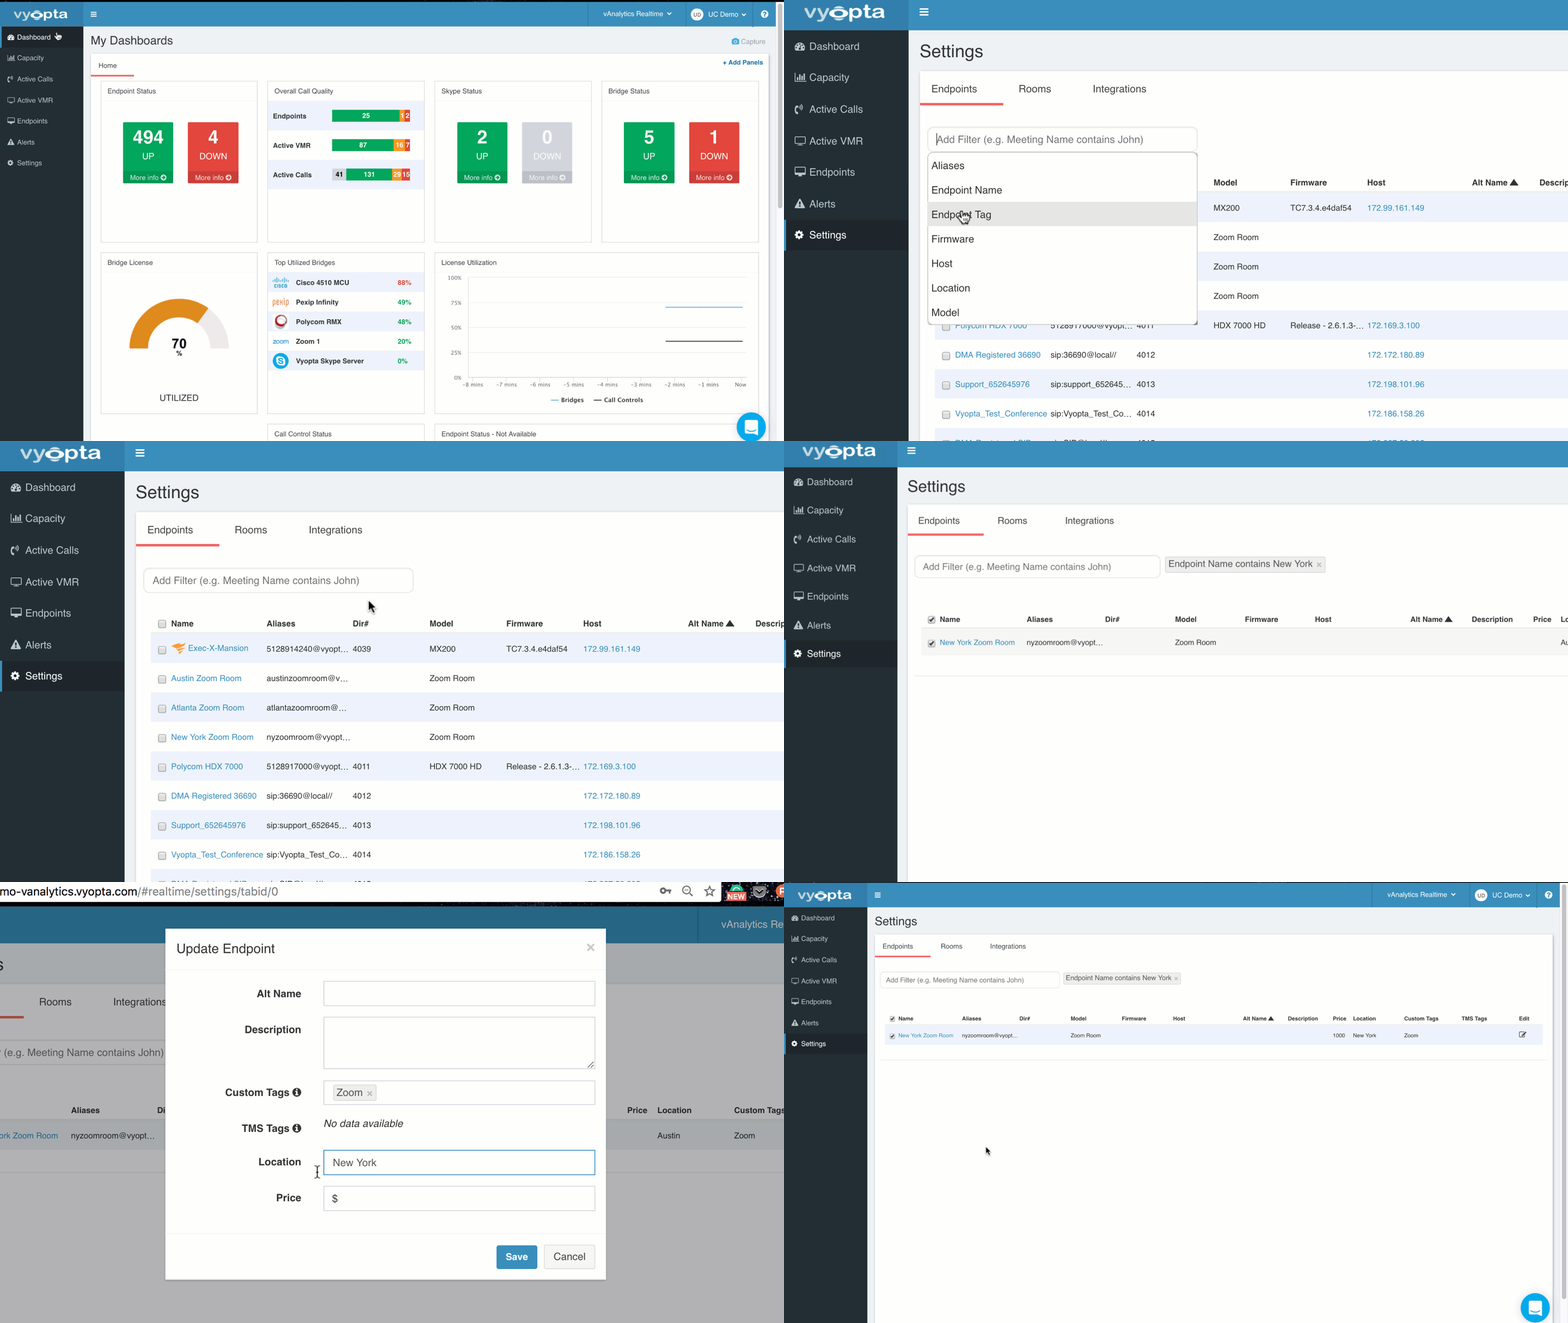
One thing that we get asked a lot is how customers can generate their own reports based on things like location or department. Here is a quick guide with some links for more information. First, reporting and creating custom panels is based on tags. You can access tags in the Settings tab on the left nav in vAnalytics. .

From there you can view your current tags for price, location, custom tags, and tags automatically imported from TMS folders. Here you can edit individually by selecting an endpoint, or you can use the filtering to bulk apply tags. This is especially useful for location tagging because most enterprises use naming codes like three letter airport codes for rooms that are in certain locations. You could also group by elements in any other field such as directory codes, models, or Host IP addresses (a great way to use subnets)
Here is a short animation on how to do this.

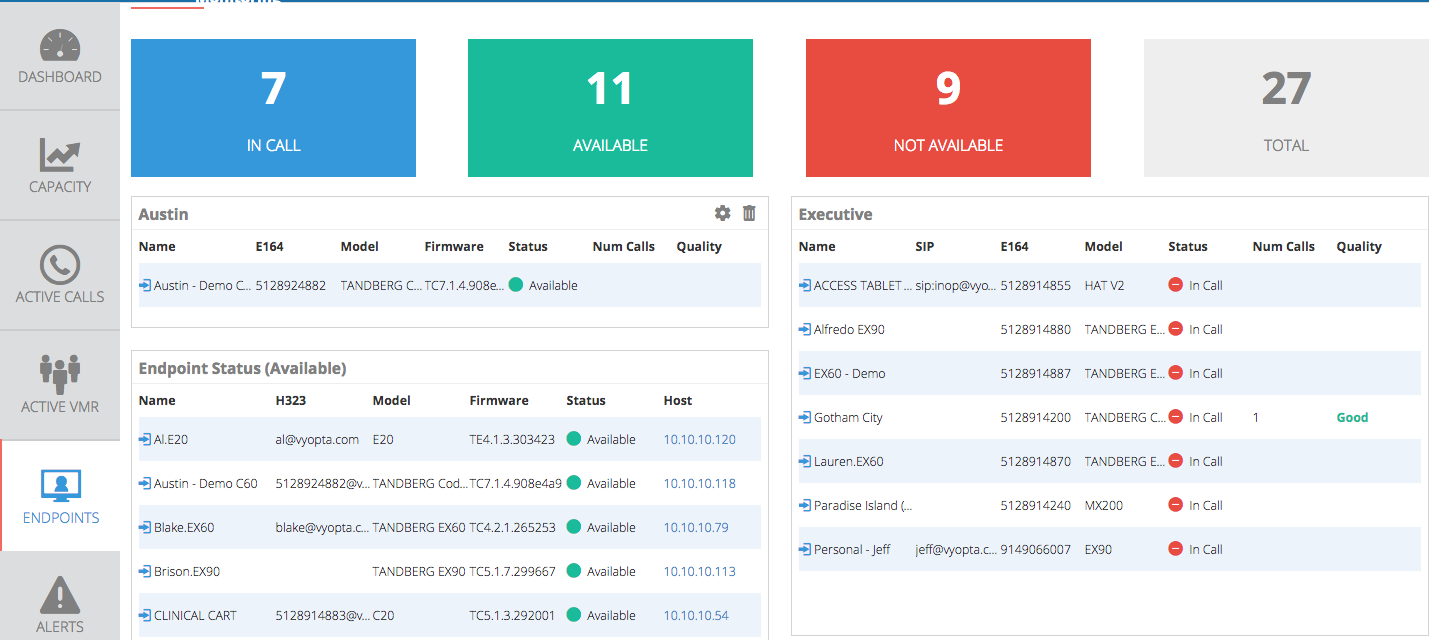
You can also use these tags to create monitoring groups in the Endpoints tab.

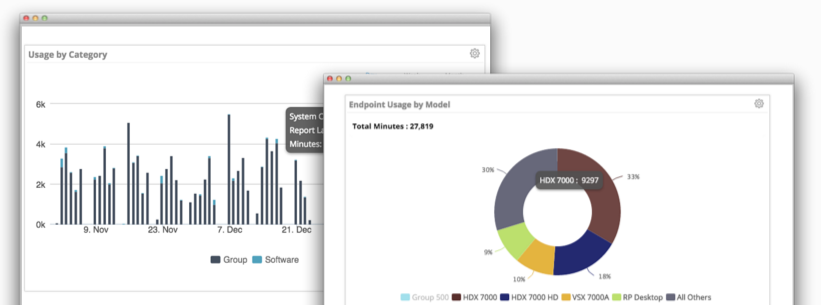
The tags will be processed overnight so that you can then leverage them in historical analytics using the same filtering method pictured above for Real Time. Check out this longer video for another historical reporting use case.


